
ROS 2 - Data display with RViz2
RViz is a graphical tool for ROS that enables visualization of a wide range of data through plugins supporting various topic types. RViz 2 is the ROS 2-compatible version of this tool.
The zed_display_rviz2 package includes a Python launch script, display_zed_cam.launch.py, which starts a preconfigured RViz 2 session tailored for ZED cameras.
If you wish to create a custom RViz 2 configuration, you can combine the plugins described in the sections below.
📌 Note: RViz 2 is a resource-intensive application that shares GPU resources with the ZED SDK. Running RViz 2 on embedded NVIDIA® Jetson™ devices is not recommended, as it may degrade the performance of active nodes. For optimal results, run RViz 2 on a separate computer connected to the same ROS 2 local network.
Global Options #
To visualize data from the ZED camera in RViz 2, ensure the Global Options are configured appropriately:
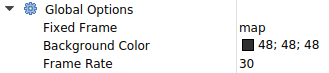
Key parameters:
Fixed frame: Set this to the frame that serves as the reference for all other frames, typicallymaporodom.Frame rate: Adjust this to control how frequently the 3D view updates. Lower values can help reduce GPU load if you experience performance issues.
📌 Note: RViz 2 competes with the ZED SDK for GPU resources. If you experience performance issues, consider reducing the
Frame Ratesetting value or running RViz 2 on a separate computer connected to the same ROS 2 local network.
Grid #
This plugin displays a grid, typically representing the floor plane, to provide spatial reference within the 3D scene. The grid helps orient objects and frames in RViz 2, making it easier to interpret positions and relationships in the environment.
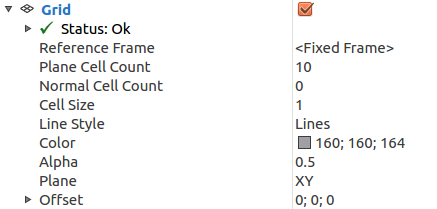
Key parameters:
Reference frame: The frame used as a reference for the grid coordinates (normally:<fixed_frame>)Plane cell count: The size of the grid in cellsNormal cell count: The number of cells in the direction normal to the grid plane (normally:0)Cell size: Dimensions in meters of each grid cellPlane: The two axes that identify the grid plane
Robot model #
This plugin enables visualization of the robot’s 3D model as defined by its URDF (Unified Robot Description Format) file. It provides a graphical representation of the robot’s structure, including its links and joints, allowing you to inspect the robot’s configuration and verify that the model is correctly loaded in RViz 2.
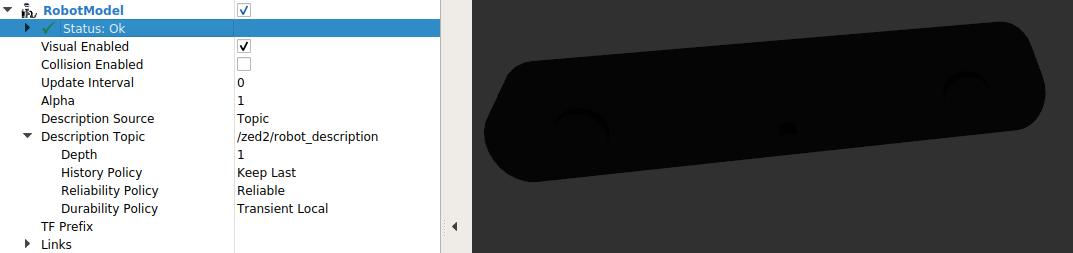
Key parameters:
Visual enabled: Enable/disable the 3D visualization of the modelDescription Source: You can choose betweenFileandTopic. At the moment of writing this guide theTopicoption is not working as expected, soFileis the right optionDescription File: the URDF file that contains the Robot Descriptionzed.urdforzedm.urdf.
By expanding the Links item, you can see the whole model tree, with all the joints and the links available and the relative position and orientation in the space relative to the fixed frame.
TF #
The TF plugin provides a visual representation of the entire transform (TF) tree, displaying the position and orientation of all coordinate frames in your system. This helps you understand the spatial relationships between different parts of your robot and environment, making it easier to debug frame alignment and connectivity issues.
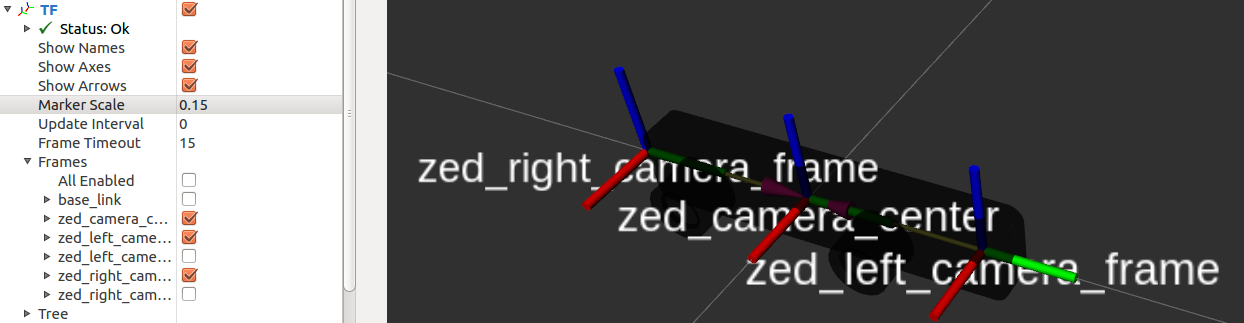
Key parameters:
Show names: Enable/disable the 3D visualization of link namesShow axes: Enable/disable the 3D visualization of the axes of the framesShow arrows: Enable/disable the 3D visualization of the arrows that connect the various framesMarker Scale: Used to rescale all the TF objects to let them be more visible and less chaoticUpdate interval: The update time in seconds. Leave at0to see each update
A key feature of the TF plugin is the ability to selectively enable or disable the visualization of individual frames. This flexibility lets you focus on specific parts of the transform tree relevant to your current task, reducing visual clutter and making it easier to analyze relationships between frames.
Video #
Learn how to set up RViz 2 to visualize video streams from your ZED camera by following the Video with RViz 2 tutorial. This guide covers configuring the appropriate plugins and topics to display real-time camera images within the RViz 2 interface.
Depth Sensing #
Learn how to set up RViz 2 to visualize depth information from your ZED camera by following the Depth with RViz 2 tutorial. This guide explains how to configure the necessary plugins and topics to display real-time depth maps within the RViz 2 interface.
Positional Tracking #
Learn how to configure RViz 2 to visualize positional tracking data from your ZED camera by following the Positional Tracking with RViz 2 tutorial. This guide explains how to display the camera’s pose and trajectory in real time, helping you monitor localization and movement within your environment.
Object Detection #
Learn how to set up RViz 2 to visualize Object Detection results from your ZED camera using the custom Stereolabs plugin by following the Object Detection with RViz 2 tutorial. This guide covers configuring the necessary plugins and topics to display detected objects and their attributes in real time within the RViz 2 interface.
Body Tracking #
Learn how to configure RViz 2 to visualize Body Tracking data from your ZED camera using the custom Stereolabs plugin by following the Body Tracking with RViz 2 tutorial. This guide explains how to set up the necessary plugins and topics to display detected bodies and their attributes in real time within the RViz 2 interface.
Plane Detection #
Learn how to configure RViz 2 to visualize plane detection results from your ZED camera by following the Plane Detection with RViz 2 tutorial. This guide explains how to set up the required plugins and topics to display detected planes and their attributes in real time within the RViz 2 interface.