ZED Sensor Viewer
ZED Sensor Viewer is the tool that lets you monitor the IMU data and other sensor information from the ZED camera. It provides a real-time view of the camera’s sensor data, including accelerometer, gyroscope, and magnetometer readings (when available).
Run ZED Sensor Viewer
After connecting your camera and installing the ZED SDK, you can run ZED Sensor Viewer to visualize the sensor data.
ZED Sensor Viewer is an application for ZED sensor data visualization. It lets you visualize the IMU data, Magnetometer data (for ZED 2i), and other sensor information in real-time. You can also calibrate the Magnetometer sensor on the ZED 2i model.
Under Windows, you can find ZED Sensor Viewer in the Start menu under the ZED SDK folder. You can also run it from the command line by navigating to the ZED SDK installation directory: C:\Program Files (x86)\ZED SDK\tools\ZED Sensor Viewer.exe
Under Ubuntu, you can run ZED Sensor Viewer from the terminal by typing ZED_Sensor_Viewer or by navigating to the ZED SDK installation directory: /usr/local/zed/tools/ZED_Sensor_Viewer
Select the camera
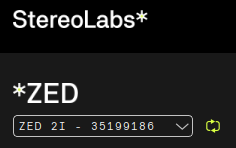
When you launch ZED Sensor Viewer, it automatically detects all connected ZED cameras and opens the first available. You can select the camera you want to use from the dropdown menu at the top left of the window.
You can click on the arrows icon on the right side of the dropdown menu to refresh the dropdown content after unplugging and replugging one camera.
Visualize the data
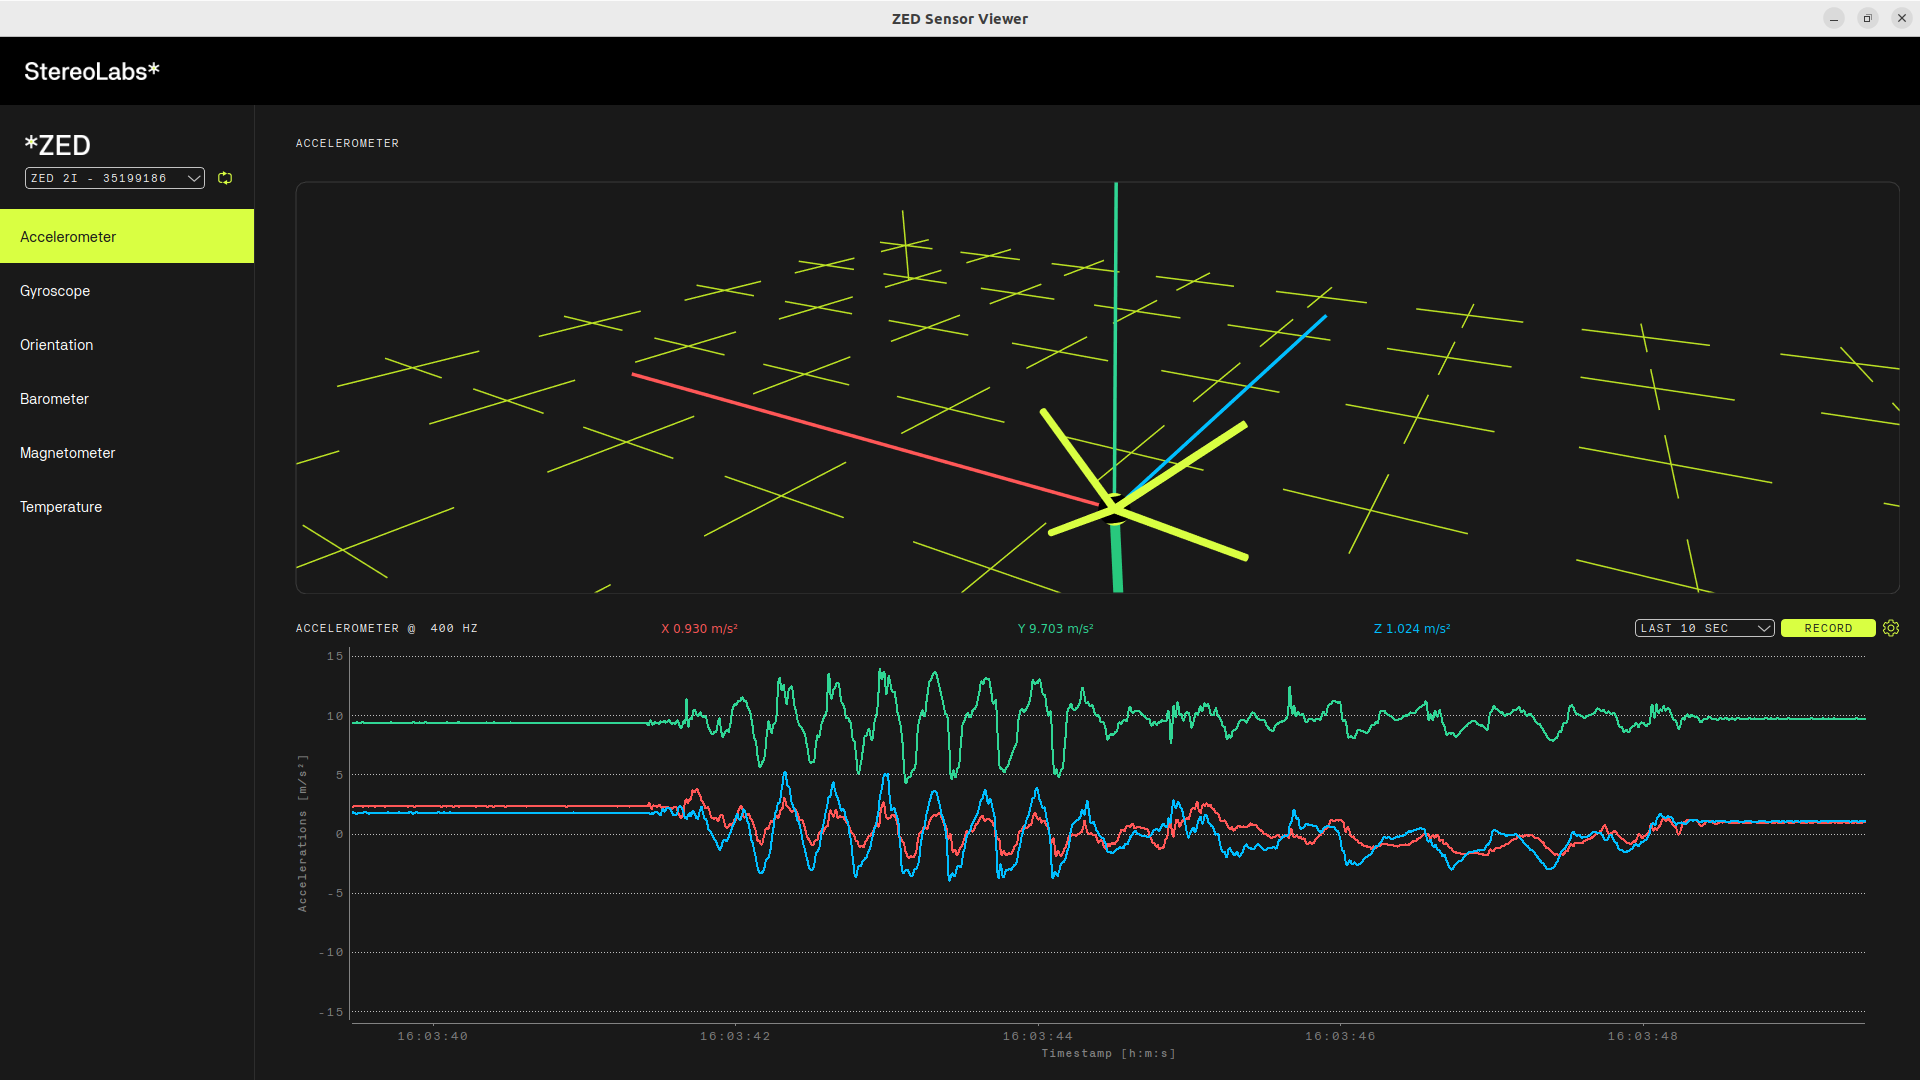
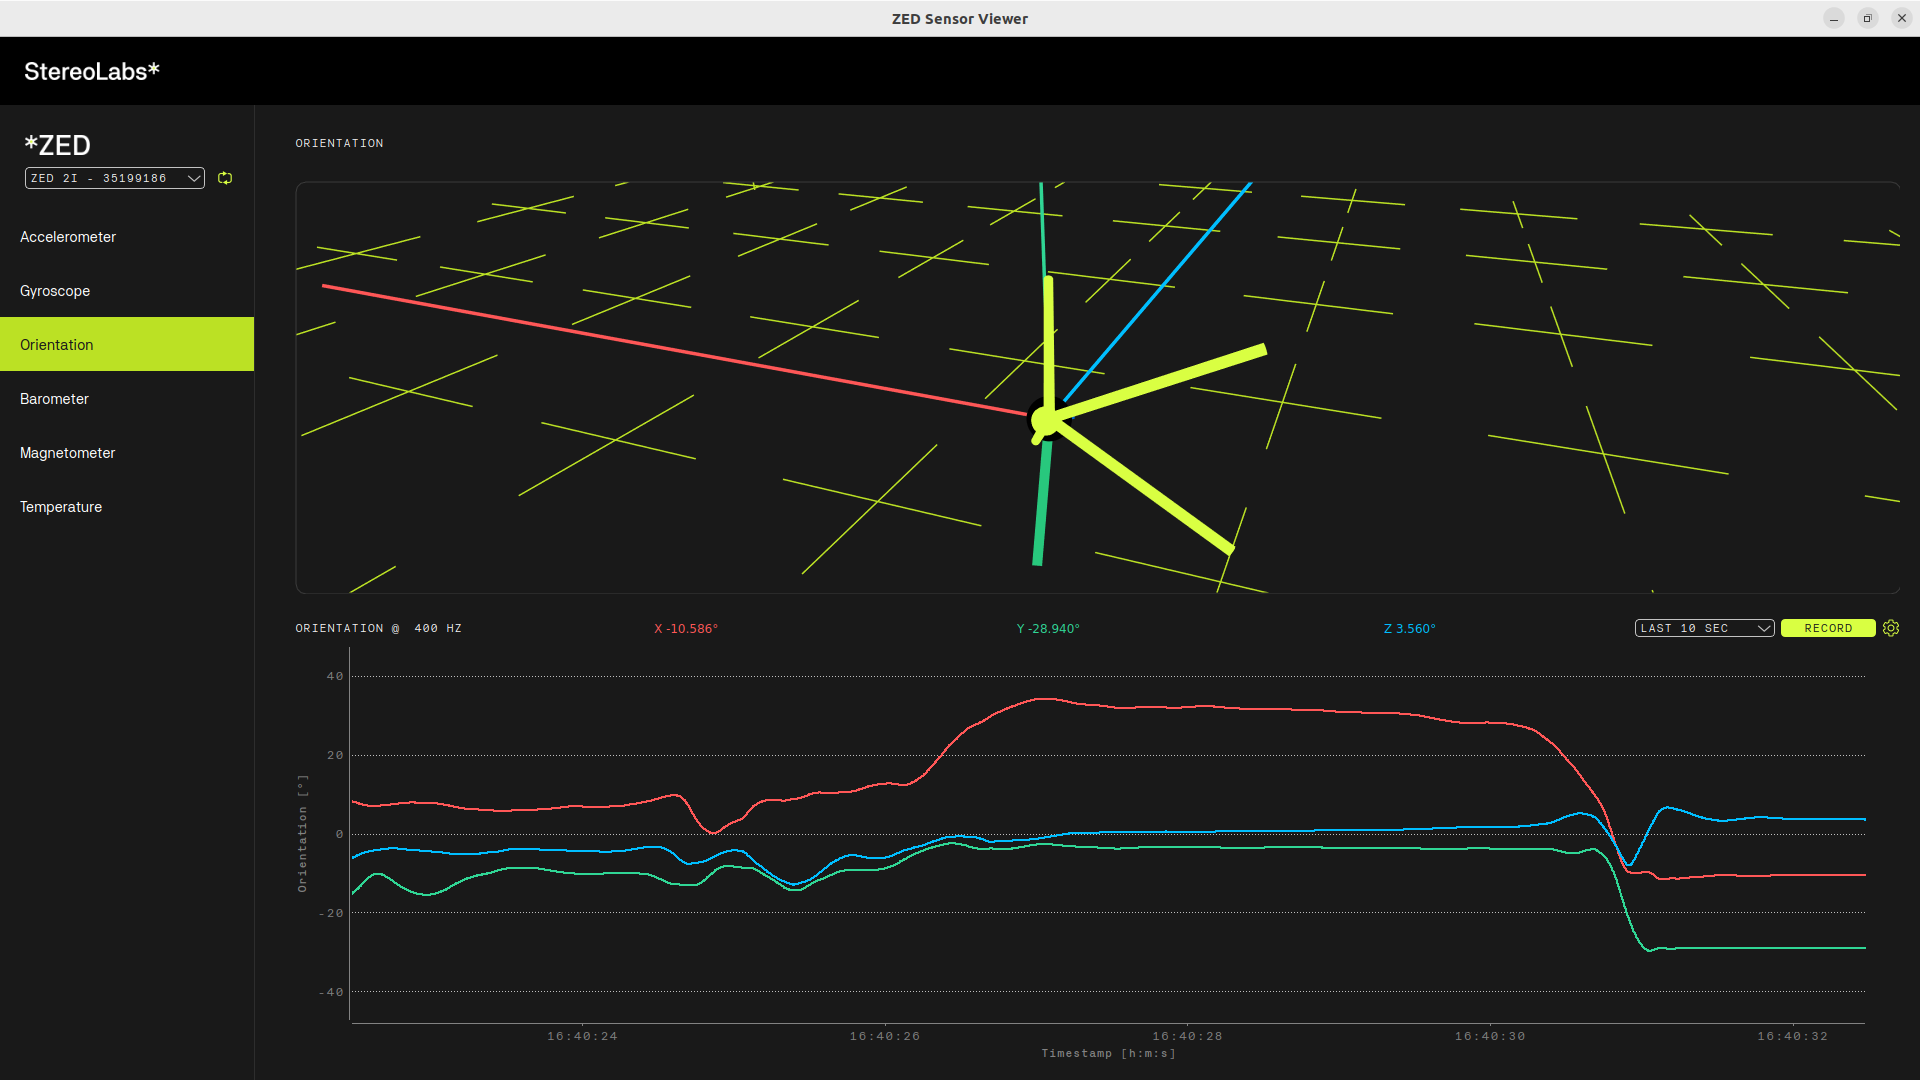
The interface of ZED Sensor Viewer is divided into three main sections:
- Sensor selection: Allows you to select the sensor data you want to visualize:
- Accelerometer: Displays the accelerometer data in 3D space, showing the acceleration along the X, Y, and Z axes.
- Gyroscope: Displays the gyroscope data in 3D space, showing the rotation around the X, Y, and Z axes.
- Orientation: Displays the camera’s orientation data in 3D space, showing the roll, pitch, and yaw angles.
- Barometer: Displays the barometer data, showing the atmospheric pressure and altitude (only available for ZED 2i).
- Magnetometer: Displays the magnetometer data in 3D space, showing the magnetic field strength along the X, Y, and Z axes (only available for ZED 2i).
- Temperature: Displays the camera’s internal temperature, which can be useful for monitoring the camera’s performance and health.
- Camera Orientation: Displays the camera’s orientation data in the space with a 3D model of the camera, allowing you to visualize how the camera is positioned in space with respect to the gravity vector.
- Data Plot: Displays the real-time data from the selected sensor in a graphical format, allowing you to visualize changes over time.
Save the data
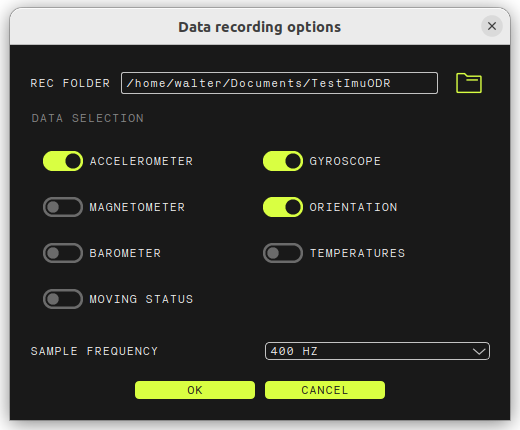
You can save the sensor data to a CSV file by clicking on the SAVE button at the middle right of the interface. This allows you to export the data for further analysis or processing.

You can select the data saving duration by selecting the available options in the dropdown menu:
- 5 seconds: Saves the data for 5 seconds.
- 10 seconds: Saves the data for 10 seconds.
- 30 seconds: Saves the data for 30 seconds.
- 60 seconds: Saves the data for 60 seconds.
You can also select the destination folder, what data to save, and the data frequency by clicking on the gear icon on the right of the RECORD button. This opens the Data Recording Settings dialog, where you can select the data to save and the destination folder.
Calibrate the Magnetometer (ZED 2i only)
When you select the Magnetometer sensor, a new button appears in the bottom left corner of the interface: Calibrate Magnetometer. This button allows you to calibrate the Magnetometer sensor on the ZED 2i model.
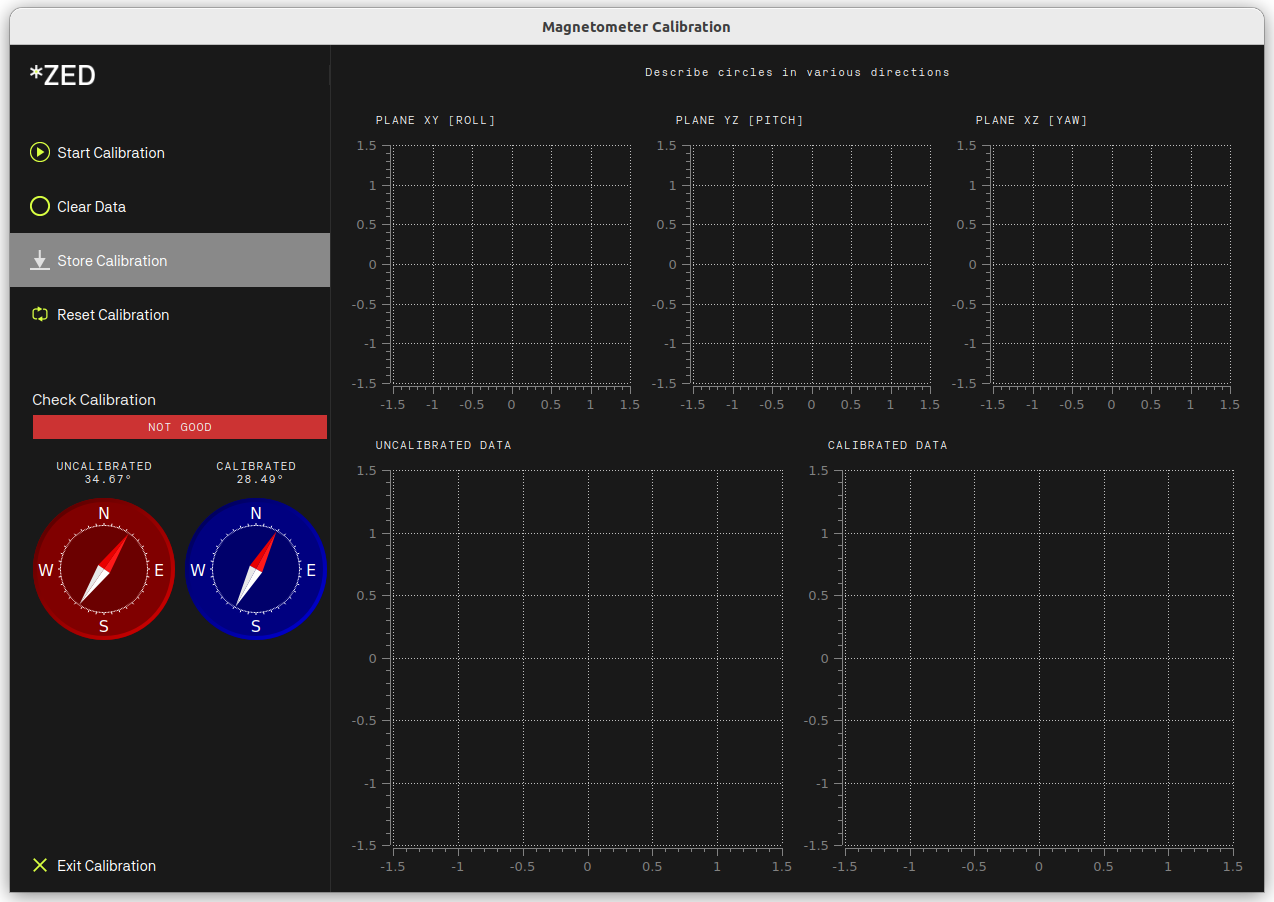
The calibration process is described in detail in the ZED 2i Magnetometer Calibration section.